A World of Blinkenlights
There is this scene in WarGames (1983, which I have watched an embarrassing number of times) where a teenage hacker’s modem connects to what he thinks is a games company. It’s actually the War Operation Plan Response (WORP) computer and the big screen fills with a world map: bombers, submarines, missile trajectories, each ending in a flashing symbol where a warhead is about to land. For anyone passionate about old computer systems, that map with the blinking lights was what a serious computer looked like. These days, a printed world map, some RGB LEDs, and a WiFi-enabled microcontroller can do the same: except the cities are my Cloudflare traffic from the last hour, and the only thing about to be wiped out is a politely worded 404 page.
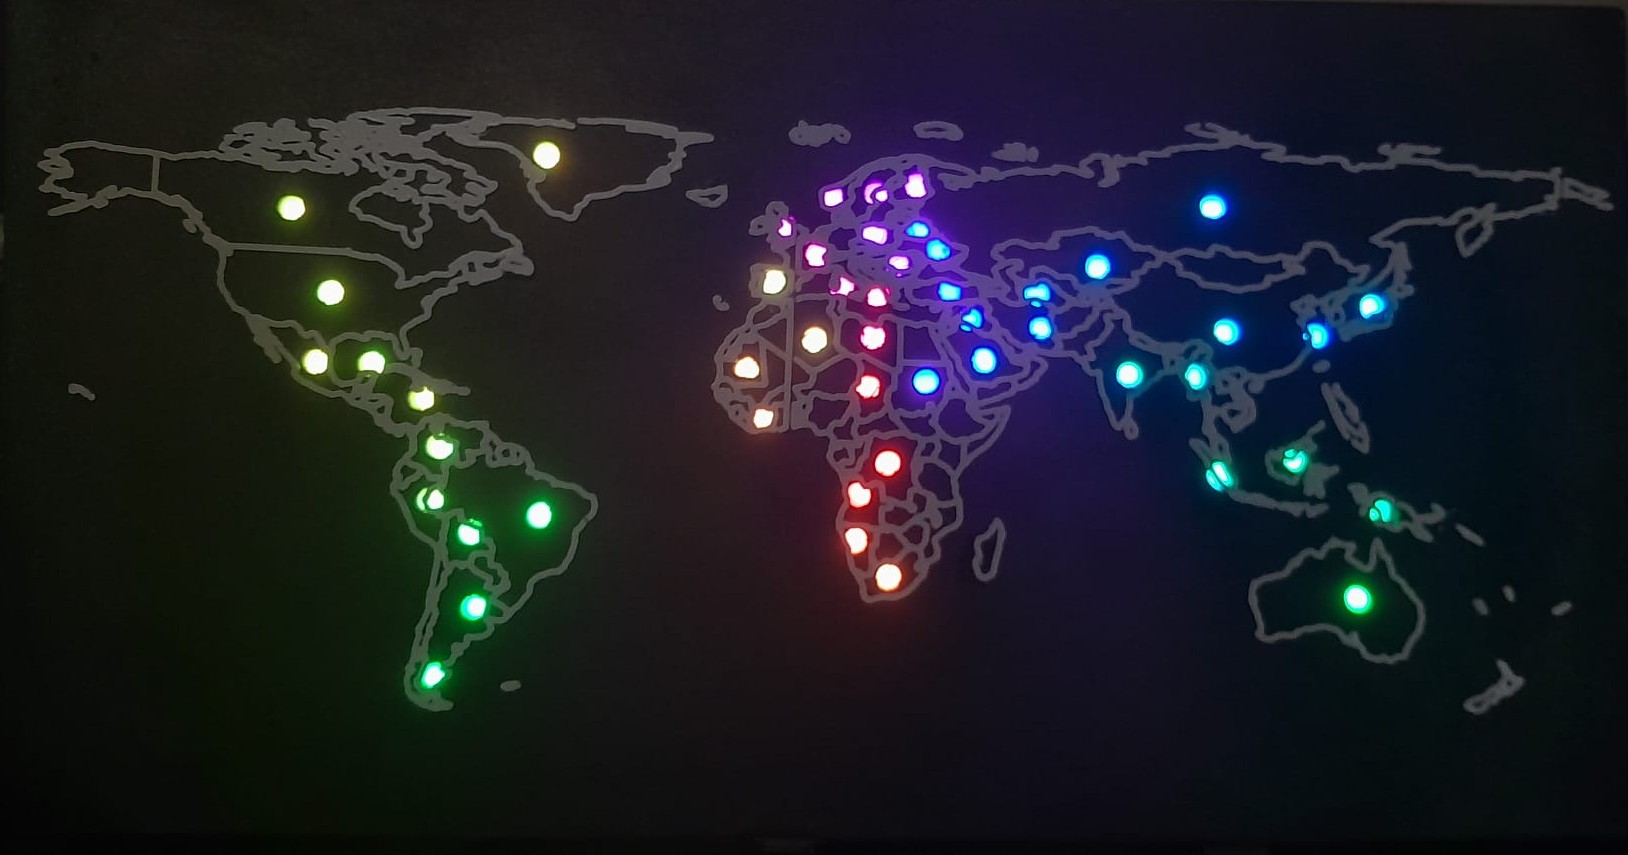
But why?
The first why is the so-called blinkenlights tradition. If you have spent enough time around computer rooms of a certain vintage, or around hacker culture at all, the term is unremarkable. The Wikipedia page is worth a detour for the classic mock-sign alone:

The point of the joke is that engineers used to look at blinking lights and understand something from them: on PDP-8 front panels, on the Altair 8800 (I totally recommend taking a look into the Relay Computer playlist by DiPDoT on Youtube for more blinkenlights shenanigans), and on the Connection Machine in the eighties. They were the diagnostic UI of last resort. The blinkier it is, the harder the CPU is working. Sometimes that was all the visibility an operator got. I always enjoyed blinkenlights myself, whether it’s my router or switch’s ethernet activity LEDs or my NAS’s disk activity blinks, so why not build something where the blinks are the whole point?
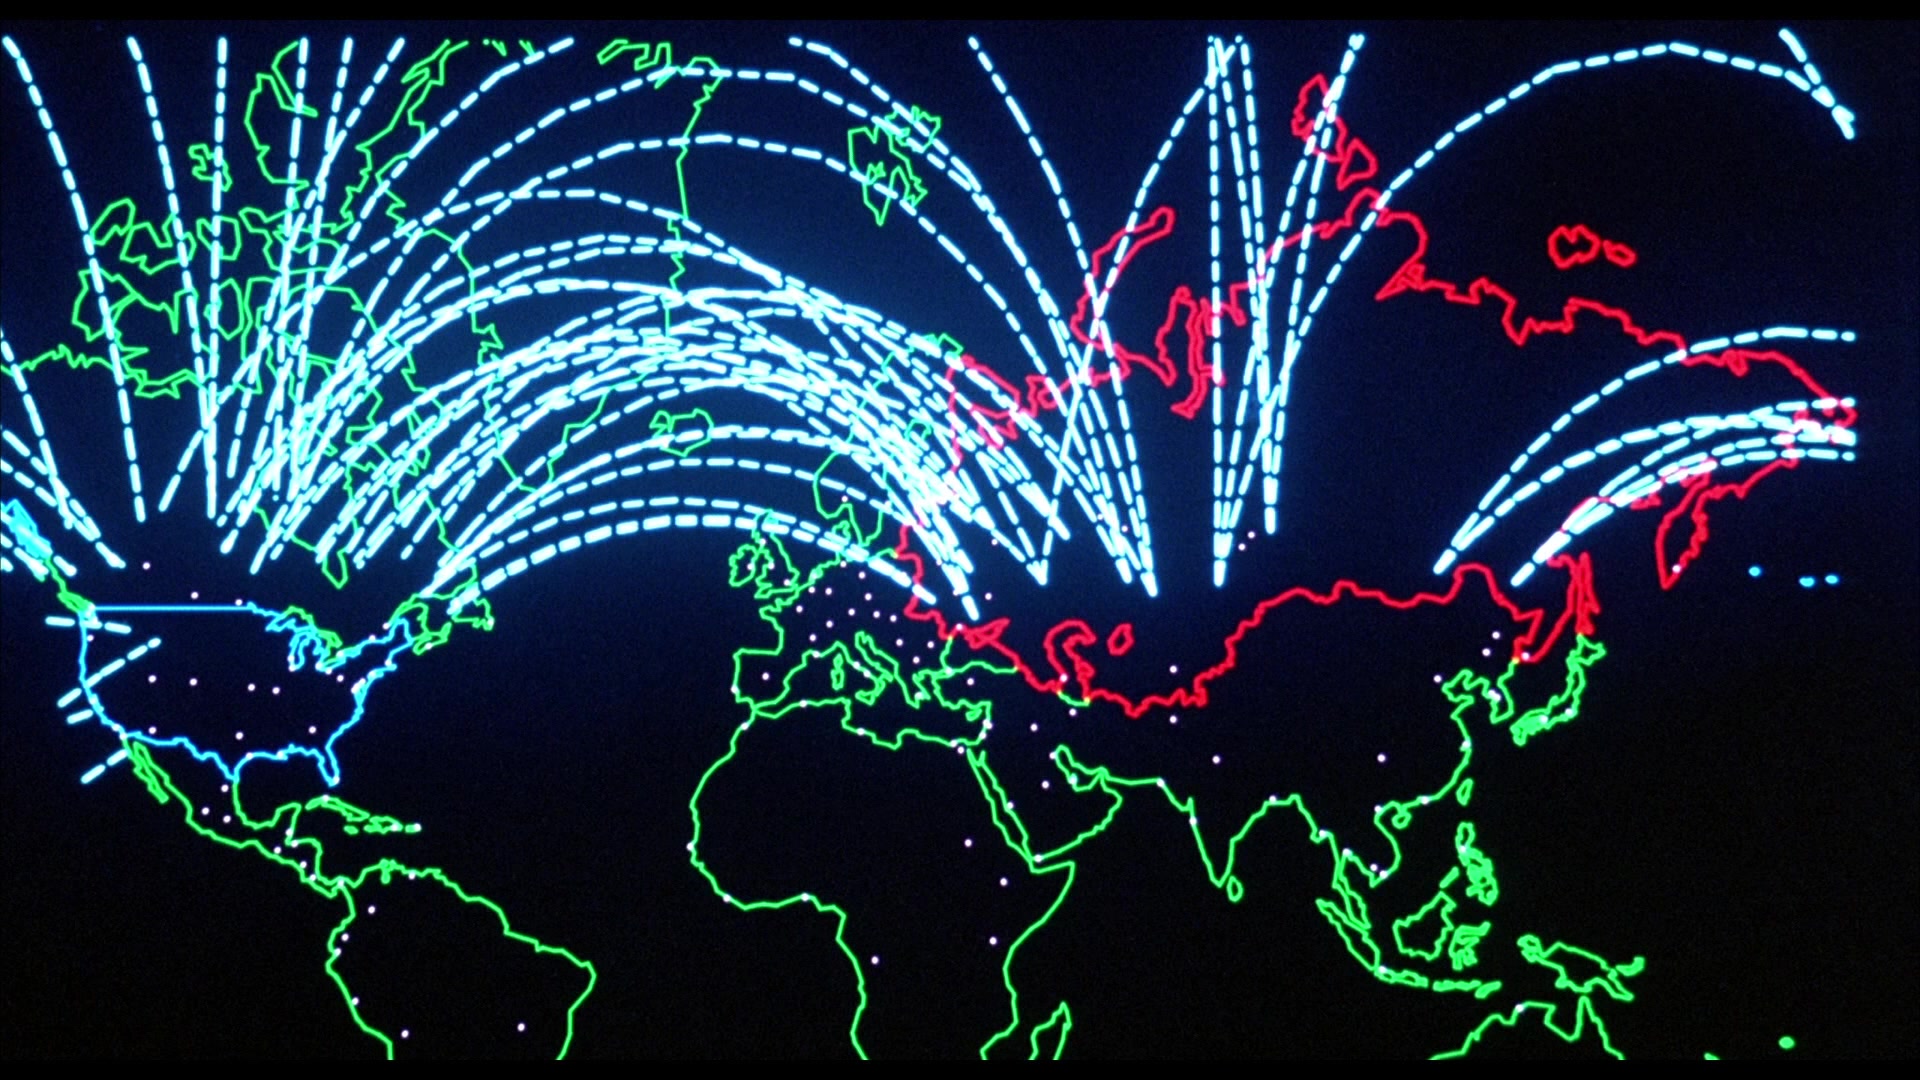
The second why is that scene in WarGames, which is, in practice, the pop-culture version of the same idea. A world map behind the WOPR console lights up red wherever a Soviet warhead is about to land; that map is more or less a glorified blinkenlights panel, painted with the political geography of the cold war so the audience knows what they are rooting for. Replace “warhead” with “HTTP error from a Cloudflare edge,” and you have, more or less, the same visual: a panel, a map, lights that flash when something is happening somewhere in the world.
Building the Map
I wanted something physical: not a printout taped to a wall, not a poster frame, and not another screen (that’s already been done, like this WarGames-themed firewall events visualizer), but an actual object with depth and weight. There’s something satisfying about a physical LED blinking that a pixel on a screen doesn’t have; it’s tangible, part of what’s called physical computing. So I committed to the full adventure: an SVG map with what seemed like the right number of divisions and resolution, then 3D printing it, painting, drilling, and gluing in way too many LEDs.
From GeoJSON to SVG to 3D Print
The starting point was Natural Earth’s GeoJSON, a freely available vector dataset of world country boundaries. I asked OpenCode’s Zen models to write a Python script that reads the GeoJSON, groups countries into 50 regions, projects lat/lon coordinates onto a 2000×1000 SVG canvas using a simple equirectangular projection, and spits out an SVG file with one <path> per region. Three prompts and a couple of corrections got me there:
import urllib.request, json, re

URL = "https://raw.githubusercontent.com/nvkelso/natural-earth-vector/master/geojson/ne_110m_admin_0_countries.geojson"
OUT = "world_map_50regions.svg"
W, H = 2000, 1000

with urllib.request.urlopen(URL) as resp:
    data = json.loads(resp.read())

features = data["features"]

REGIONS = [
    ["United States of America"],
    ["Canada", "Greenland"],
    ["Mexico"],
    ["Guatemala", "Belize", "Honduras", "El Salvador", "Nicaragua", "Costa Rica", "Panama"],
    ["Cuba", "Jamaica", "Haiti", "Dominican Rep.", "Bahamas", "Trinidad and Tobago", "Puerto Rico"],
    ["Brazil"],
    ... # 50 regions total
]

def project(lon, lat):
    x = (lon + 180) / 360 * W
    y = (90 - lat) / 180 * H
    return (round(x, 2), round(y, 2))
Each region’s polygon rings get flattened into a single SVG path (M{x},{y} L{x},{y} ... Z), and the whole thing lands as a clean XML file. I loaded the SVG into Bambu Studio, extruded the paths into a flat relief model, and sent it to a Bambu Lab A1. The build plate is 256×256 mm, so the map had to be split into two parts — left hemisphere and right hemisphere — joined along a seam somewhere in the Atlantic.
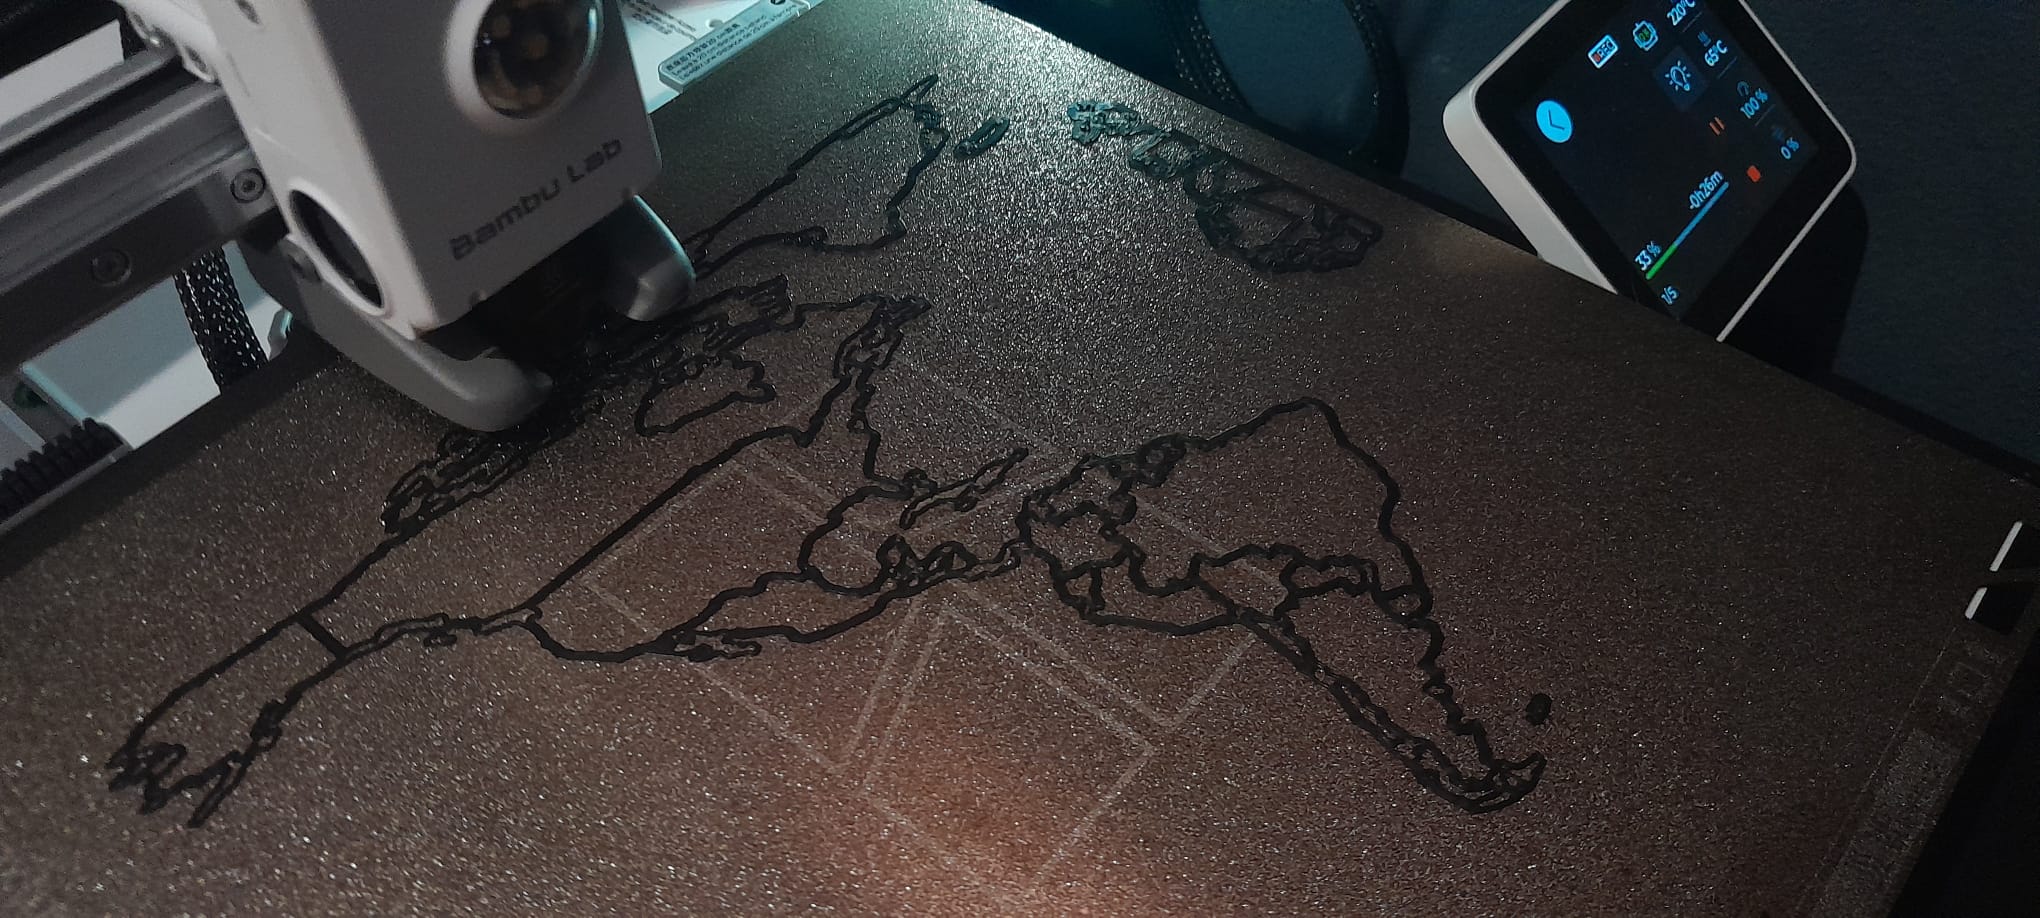
I did not have white filament on hand, so both halves came out in black PLA, spray-painted white afterwards. Between the seam alignment and a slightly patchy paint job, the map has its share of small imperfections up close — some country boundaries are a hair off where the two halves meet, and a few regions show thin spots where the black peeks through the paint. None of it matters once the LEDs are on and the room is dim.
The printed map pieces are mounted on a MDF board, painted matte black. MDF is cheap, sturdy, and takes spray paint without warping. I drilled 50 holes through the MDF behind each region cluster, matching the layout of the country outlines on the 3D printed front layer. Each hole is sized for a 7.5mm LED body.
The LEDs
The LEDs are BTF-LIGHTING WS2811 5V individually addressable leds which come on a thin wire string with a small diffused dome over each LED, originally meant for Christmas decorations or cosplay. The 5V WS2811 protocol is the same as any WS2812B strip, so FastLED drives them out of the box. Each LED is poked through its drilled hole from the back, held in place with a dab of hot glue. The wires snake across the back of the MDF board in a rough daisy chain.
Drilling 50 holes freehand on MDF by eye, with no jig, is an exercise in optimistic geometry (which could have been avoided by printing a jig). The 50 regions were decided upfront, in the GeoJSON/Python step, but matching each physical LED to the right region turned out to be a separate problem: the drilling wasn’t precise enough to guarantee every hole landed cleanly inside its intended region. To fix it, I wrote a throwaway sketch that blinked one LED at a time, in order, noted down which physical location each one lit up, and matched that back to the region it actually fell into. led_map.h reflects that remapping, not just the original division.
The ESP32
The brain is a Lolin32 v1.0.0, which is a cheap ESP32 developer board. It sits on the back of the MDF board (on a 3D printed generic box), connected to the LED string’s data line on GPIO 16. Power is dead simple: the Lolin32’s 5V output pin drives the strip directly — no external power brick needed. Fifty WS2811 LEDs at half brightness pull well under the pin’s current limit. No level shifter, no capacitor on the power rail, no resistor on the data line… I know the WS2811 datasheet calls for all three, but this setup runs fine without them, and I am not building a production unit.
The 50 LEDs correspond to the 50 country clusters from the remap process after drilling. Portugal and Spain share an LED. Scandinavia gets a few. The Caribbean islands are bundled together. The mapping lives in led_map.h as a simple string array of ISO 3166-1 alpha-2 codes:
static const char* LED_MAP[50] = {
  "CL AR",                             // 0  Chile, Argentina
  "UY PY",                             // 1  Uruguay, Paraguay
  "BR",                                // 2  Brazil
  ...
  "AU NZ",                             // 49 Australia, New Zealand
};
Every 60 seconds the firmware queries the Cloudflare GraphQL API for the last completed hour of traffic, groups requests by clientCountryName and edgeResponseStatus, and maps each country onto one of these 50 LEDs. Requests with HTTP status ≥ 400 count as red; everything else is green. The busiest region gets 30 blinks over the next minute, and every other region gets a proportional fraction of that — so if Canada generates half the traffic of the United States, it gets ~15 blinks, distributed evenly across the 60-second window.
There is also a boot animation: while waiting for WiFi and NTP, the strip cycles through a rainbow hue sweep so you know something is happening. On first successful fetch, all LEDs flash green twice — your “OK, we’re live” signal.
Total bill of materials
| Item | Cost |
|---|---|
| Lolin32 v1.0.0 | ~€7 |
| BTF-LIGHTING WS2811 LED strip (50 LEDs) | ~€20 |
| MDF board (A2-ish, offcut) | already had it |
| Black PLA filament (for the map, painted white) | already had it |
| White and black spray paint cans | ~€8 |
| Hot glue sticks | already had them |
| USB cable | salvaged from a drawer |
| Total | ~€35 |
Plus about 2 afternoons of printing, painting, drilling, wiring, and firmware tweaking — most of which was spent waiting for prints to finish and paint to dry.
The Firmware
The firmware is a single-file PlatformIO project on the Lolin32, built around two external libraries — FastLED for the strip, ArduinoJson for the Cloudflare response — and not much else. I gave OpenCode’s free Zen models the spec (what LEDs, what API, what mapping, what timing) and it wrote main.cpp, the country mapping headers, and the config file; I pasted back error logs when something broke and it fixed them. The hardware — wiring, drilling, gluing, painting, mounting — was all done by hand. Lazy is the way, at least for the parts I was happy to hand off. The Cloudflare API token setup takes about two minutes. Head to dash.cloudflare.com/profile/api-tokens, create a custom token with Zone → Analytics → Read, drop the token and your zone ID into your project config or global variables, and off you go.
The query fetches the previous completed hour as Cloudflare’s minute-resolution data has a ~5 minute ingestion delay. So instead I pull one full, settled hour of aggregated data:
{
  viewer {
    zones(filter: { zoneTag: "$ZONE" }) {
      httpRequestsAdaptiveGroups(
        limit: 500
        filter: { datetime_geq: "$START", datetime_leq: "$END" }
      ) {
        dimensions { clientCountryName edgeResponseStatus }
        count
      }
    }
  }
}
I originally wanted to pull from firewallEventsAdaptive as well, so the map could distinguish “blocked by WAF” from “just a regular 404.” That didn’t work: firewall/security event access on the GraphQL Analytics API is more limited on Cloudflare’s free plan than on paid tiers, and my zone doesn’t qualify (as far as I could find out). More granular event data would have let me use more than just two colors — the LEDs support full RGB, and right now I’m only using red and green. So I fell back to httpRequestsAdaptiveGroups, which is available on a free zone and still includes edgeResponseStatus per row — enough for red/green discrimination, even if it can’t tell me why a request was flagged. The limit: 500 is a Cloudflare-imposed bound that I never even get close to; a typical response is under 200 rows.
On the ESP32 side, the JSON response lands in a DynamicJsonDocument (~24 KB). The response is unpacked in a single pass: each row’s clientCountryName is matched against LED_MAP via a strstr-based linear scan, the count is accumulated into per-LED green and red buckets, and then everything is normalized against the busiest region.
for (JsonVariant v : entries) {
    const char* cc = v["dimensions"]["clientCountryName"];
    int status = v["dimensions"]["edgeResponseStatus"] | 200;
    uint32_t cnt = v["count"] | 0;
    int led = countryToLed(cc);
    if (led < 0) continue;
    greenCount[led] += cnt;
    if (status >= 400) redCount[led] += cnt;
}
After normalization, each LED gets a number of green and red blinks scheduled across the upcoming 60-second fetch interval:
for (int i = 0; i < NUM_LEDS; i++) {
    int g = 0, r = 0;
    if (maxGreen > 0) g = ((uint32_t)greenCount[i] * MAX_BLINKS) / maxGreen;
    if (maxRed > 0) r = ((uint32_t)redCount[i] * MAX_BLINKS) / maxRed;
    if (greenCount[i] > 0 && g == 0) g = 1;
    if (redCount[i] > 0 && r == 0) r = 1;
    if (g + r > MAX_BLINKS * 2) {
        float scale = (float)(MAX_BLINKS * 2) / (g + r);
        g = g * scale; r = r * scale;
    }
    ledState[i].totalRemaining = g + r;
    ledState[i].interval = ledState[i].totalRemaining > 0
        ? FETCH_INTERVAL_MS / ledState[i].totalRemaining : 0;
}
Each region’s blink count is scaled against the busiest region (maxGreen, maxRed), so the region with the most traffic gets MAX_BLINKS (30) blinks and everyone else gets a proportional share. Any region with nonzero traffic gets at least one blink, so it never goes fully dark just from rounding down to zero. The interval is just the fetch window (FETCH_INTERVAL_MS, 60 seconds) divided evenly across however many blinks that LED has scheduled, spacing them out instead of firing them all at once.
What It Looks Like
The result is exactly what I wanted: a 3D printed, painted white world map on a black MDF backboard, hanging on the wall, with fifty LEDs poking through drilled holes behind each country cluster, blinking green for normal traffic and red when something goes wrong. At night, with the room lights off, it looks like a miniature NORAD set: the black background makes the map float, the white relief catches ambient light, and the LEDs are the only thing moving. Portugal blinks a lot because that is where most of my readers are. Occasionally (more than expected) a random country lights up red, usually a bot probing /wp-admin, reacting to something actually happening on the internet in real time.
The old blinkenlights panels on PDP-8s and Connection Machines displayed CPU states, memory bus activity, instruction decodes: machine internals that meant something to the operator. This thing displays HTTP status codes grouped by geography, which is less useful, but equally fun. Call it a blinkenlights panel for the application layer. The lights tell you where your readers are and whether your server is having a bad day, and that’s about as much as this kind of panel has ever promised.
None of this is actually specific to Cloudflare. The map only cares about two numbers per region: how much, and whether it’s good or bad. Anything with a country or region attached to it works the same way — GitHub stars by country, package downloads, flight delays, earthquake activity, etc. Swapping the data source just means writing a different fetchXXXData() function that fills the same greenCount[] / redCount[] arrays; the LEDs, the blink scheduling, and the map itself don’t need to change at all. It went from “a Cloudflare dashboard” to “a dashboard for anything with a lat/lon,” which is a better project than the one I set out to build.
“The only winning move is not to play.” — but if you are going to build blinkenlights anyway, at least make them blink for something.