Yet Another Raspberry Pi Cluster
Those who are hardware tinkers and hackers know how easy it is to accumulate hardware thingies: single-board computers, microcontrollers, sensors and so on. One of those are Raspberry Pi’s of different version that lay around accomulating dust. It was time to give some usage to those idle computing resources in the form of a cluster for doing some experiments with networking, distributed computing, automation, etc.
Back in 2012, a new thingy appeared that reshaped the meaning of low-cost and small single-board computers: Raspberry Pi. Its ability to run Linux and its exposed GPIO pins allowed it to become one of the most common pieces of hardware in every electronic enthusiast’s storage1. As of today, there are five different hardware families and more than 12 different models available. As a result, I had a few of these spread among storage shelves, but I always felt bad for having computing power just lying around and accumulating dust. The idea of using them as a computing cluster kept appearing in the usual places: Hackaday2, OctaPi, hackster.io, … so it appears that the time has come to do my version. This would be a pretty good playground to carry experiments with networking, distributed computing, DevOps, etc.
Bill of Material
One of the objectives was to reduce the new purchases to a minimum (but, as always, this is more easily said than done).
| Qty. | Part Name | New? |
|---|---|---|
| 1 | ewent 4-port USB Charger 5.4A | Yes |
| 1 | Raspberry Pi Cluster Case 6-Layers | Yes |
| 2 | Raspberry Pi 2 Model B Rev 1.1 | |
| 1 | Raspberry Pi 3 Model B Rev 1.2 | |
| 1 | Raspberry Pi Model B Rev 2 | |
| 1 | TP-Link TL-WR841N v.9 (factory firmware) | |
| 4 | Ethernet Cat. 5 (short, homemade from old cables) | |
| 4 | USB to Micro USB cable | Yes |
| 1 | microSD Card 8GB | |
| 2 | microSD Card 32GB | |
| 1 | SD Card 8GB |
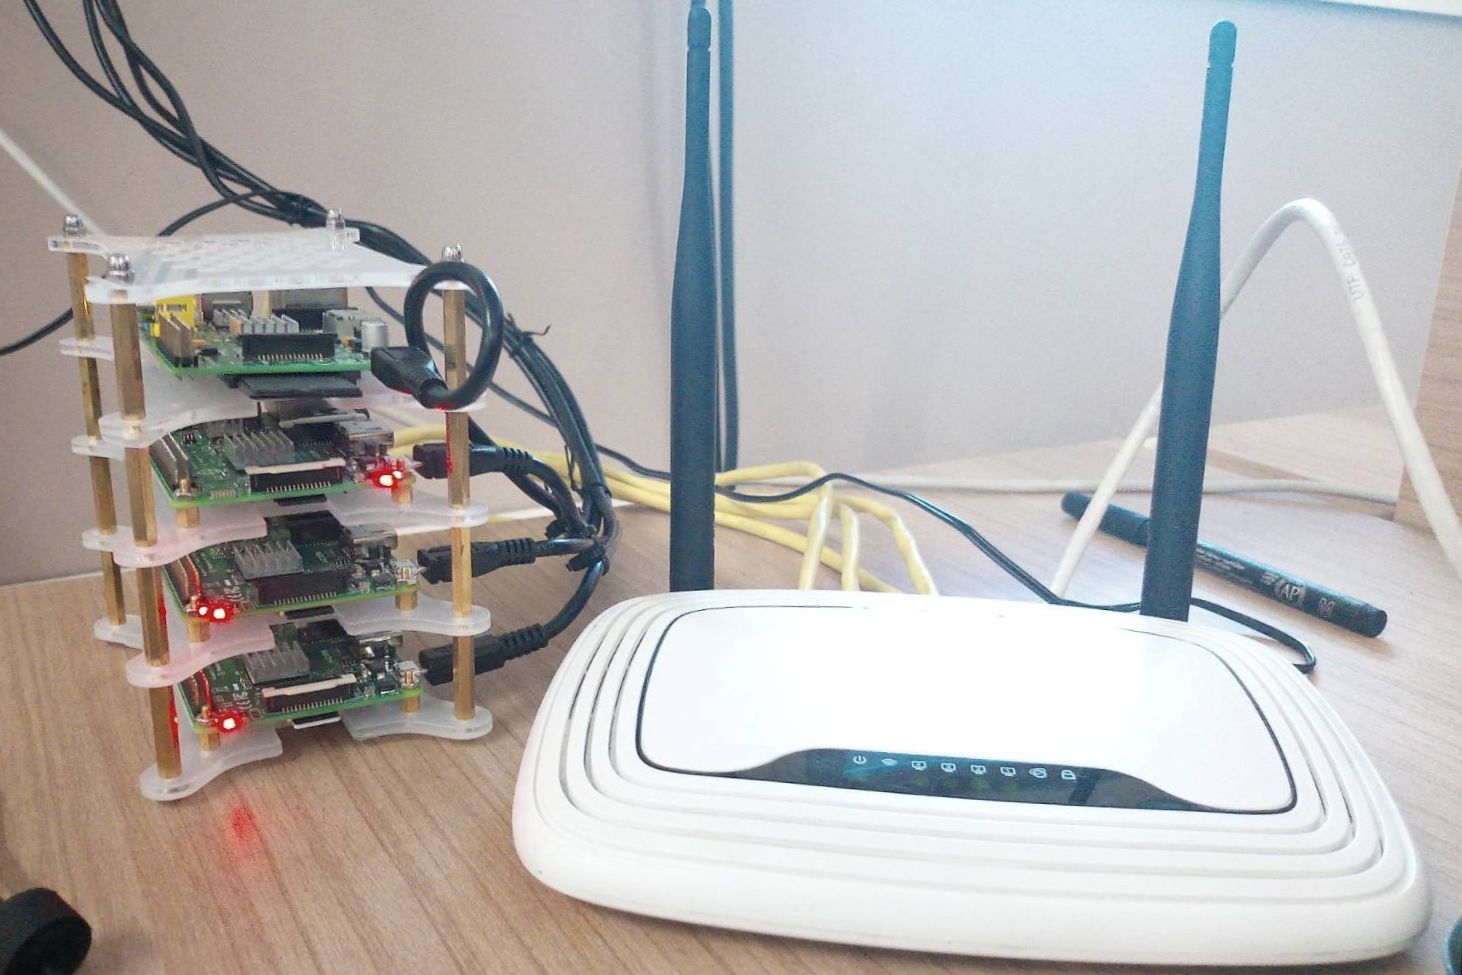
The 4-port USB Charger 5.4A is not the best option since each RPi can take around 2A; however, it was available in a nearby store, and since some of the Raspberry are older versions, it will likely suffice for the intended purpose. I, however, intend to upgrade all the system to use a common power supply unit (including the router).
From the bottom to the top of the stack we can find: (0) Raspberry Pi 2 Model B Rev 1, (1) Raspberry Pi 2 Model B Rev 1, (2) Raspberry Pi 3 Model B Rev 1, and, by the top, (3) Raspberry Pi Model B Rev 2.
Operating System
First things first, there is the need to format all the SD cards with a Raspberry-compatible OS. Since this is for headless usage and wanted things to quite work out of the box, I picked the latest Raspberry Pi OS Lite from the official website, which is Debian-based and compatible with all hardware revisions.
I flashed the SD cards using the balenaEtcher. After the flashing is complete, one manual step is needed to enable SSH on the first boot automatically: just touch a file named ssh on the boot partition of the SD card (more here). This allows the complete headless configuration of the Rasps.
Network: A side-quest
So, my end-goal was to be able to carry the cluster around when needed and be able to quickly:
- Connect to a WiFi network to enable Internet-connectivity on the Rasps;
- Have a segregated network with NAT for not depending on the upstream network;
- Minimize the number of static configurations (i.e. no static IP addresses);
- Make it easy to replace (or re-flash) or add new units to the cluster.
As a reference, the network diagram must be something like this:
┌────────────────┐
│raspberrypi0.lan├──┐
└────────────────┘  │
                    │
┌────────────────┐  │             ┌┐      ┌┐             ┌────────┐
│raspberrypi1.lan├──┤   ┌─────────┴┤ xxxx ├┴─────────┐   │        │
└────────────────┘  │   │ TP-Link  │      │   Host   ├───┤Internet│
                    ├───┤ TL-WR841N│      │ Router/AP│   │        │
┌────────────────┐  │   └──────────┘      └──────────┘   └────────┘
│raspberrypi2.lan├──┤
└────────────────┘  │
                    │
┌────────────────┐  │
│raspberrypi3.lan├──┘
└────────────────┘
Typically in this kind of builds, switches are used. However, using no-static configurations (and even a .lan local name) will require a router. Most home-grade routers have no functionalities that would favour this build, namely, using WiFi as a client-mode to provide Internet, and, consequently, the ability to bridge the WAN-port to the switch, which adds an extra useful port to the router (since WiFi provides the Internet connection). Other perks such as VLAN management and others could be useful for later experiments, so have such advanced router management capabilities would be a plus.
Finding a Working Firmware
I had three routers lying around, so the journey began of finding a proper alternative firmware that would provide such features. The best candidate among those was the Linksys WRT54G (more info) series, since it was one of the most well-supported series. However, the specific version that I have (WRT54GS v7) is only supported by an old version of DD-WRT primarily due to hardware limitations. After several hours messing around configurations, several issues with local domain resolution and DHCP led me to abandon it.
The next one was an ASUS RT-N12E_B, which, supposedly, is supported by OpenWRT. However, after flashing, I couldn’t get the router to work in WiFi client mode (the signal was so weak that even with the 3rd-party router really close to it, it would not connect). After searching around, I found out that there’s an alternative firmware for it called Padavan. This happens to be a pretty good all-around firmware but had a down-side: I could not bridge the WAN port to the switch.
The last alternative was the TP-Link TL-WR841N v.9. This router is compatible with DD-WRT, and after dealing with some region lock features (that made me flash the router with an older version of DD-WRT and then update it), it was ready to use.
Configuring DD-WRT
First off, I wanted to be able to manage the 4 RPis using my laptop, thus the need for 5 switch-connected ports. The first configuration required was to go to Setup and check the box Assign WAN Port to Switch. After that, it was needed to configure the router as WiFi client. There are two modes of WiFi client, the Client Bridge – where the router becomes part of the same subnet as the host – and Client Mode (unbridge) – where the client router is unbridged in a different subnet (with NAT). In this case, we want the last option; thus, we need to make sure that the client router is in a different subnet than the primary host router. This is explained in the DD-WRT wiki as follows:
Ensure the secondary client router is on a different subnet than the primary host router. Thus, if the primary router IP address is 192.168.A.x, you need to set the client router to an IP of 192.168.B.x. For example, if the host router uses 192.168.1.1, configure your client router to, e.g. 192.168.2.x.
We also need to enter the Wireless access credentials of the host network (Wireless->Basic Settings) and set DHCP to automatic (Setup->Basic Setup->Connection Type).
Further, we want to be able to access the RPis by their hostname, e.g. hostname.lan. To do so, we use the DNSMasq as DHCP server, by checking the Use DNSMasq for DNS in the Setup->Basic Setup, enabling Local DNS in the Administration->Services, set the LAN domain (e.g. lan), and, add the following to the Additional DNSMasq Options:
domain=lan
local=/lan/
expand-hosts
Connect everything
The next step was to connect the RPis one-by-one to the router ports and connected them to power. Every time a Pi was connected, the following procedure was followed:
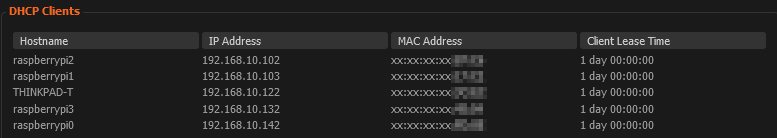
- Check the Raspberry Pi attributed IP address in the router DHCP Network table (in most of the cases, this is not needed since the devices are also accessible by its default domain name
raspberry) - Add an SSH public key to the device:
ssh-copy-id -i key.pub [email protected], authenticating with the default passwordraspberry(more on how to generate a key-pair and add them to the ssh-agent by GitHub) -
Start an SSH session, enter
sudo raspi-configand do the following changes:- Change the default hostname in
Network Options->Hostname. In my case, I just added an incremental identifier to each one, corresponding to the order they are in the cluster case, e.g.:raspberrypi0.lan - Change the default password in
System Options->Change Password of user Pi(you can also change it using thepasswdutility) - Expand the filesystem in
Advanced Options->Expand Filesystem - Reboot
- Change the default hostname in
- Repeat for each RPi.
Addendum (08/04/2021)
The DD-WRT presented several operational problems after some time, such as random reboots and reboot loops (which, eventually, lead to everything stop working). I was able to upgrade the router to an OpenWRT firmware using the TFTP recovery instructions. The manual configurations needed are:
- Change base IPv4 address in
Interfaces - LANfor something different from the third-party network, e.g.192.168.10.1. - Bridge the LAN interface to the WAN port:
Interfaces - LAN->Physical Settingsand then check Bridge interfaces and select botheth0andeth1. - Connect to the WiFi Access Point:
Network -> Wifi -> Scanand then connect. - Change
Firewallsettings forwan: Select networkswan,wan6andwwan.
More info here.
Connectivity problems
For some reason, while I could talk with the Raspberries from my laptop, I could ping an RPi from another unit with the error no route to host. This seemed a known issue with the router VLANs and WAN port reassignment, which could be fixed by adding the following to the router startup scripts:
swconfig dev eth0 set enable_vlan 1
swconfig dev eth0 set apply
After rebooting, all the network operated as expected.
Monitoring
After, finally, having the network up and running, I wanted to add some monitoring capabilities to keep track of resource usage and devices temperatures3. I have used in the past a combination of Telegraf + InfluxDB + Grafana for building such monitoring; thus, that was the go-to solution. However, I have quickly faced a peculiar problem: Telegraf is unable to use local name resolution due to some issues with the ARM builds (related discussion).
Thus it was time to try something new for some observability (o11y). I have heard of Prometheus before, so it seemed a good opportunity to try it out. They provide a similar agent to Telegraf called Node exporter. The Node exporter has builds for many architectures and worked out-of-the-box in the different Raspberry Pi versions (the original RPi, which is an armv6 and the following revisions, which are armv7). After installing, one can run it with node_exporter & exposes the device metrics in the port 9100 by default (making it easy to verify if everything is working as supposed with a simple curl http://raspberrypi0.lan:9100/metric).
If you want to make node_exporter permanent, you can create a service with it by creating a new file /etc/systemd/system/nodeexporter.service:
[Unit]
Description=NodeExporter

[Service]
TimeoutStartSec=0
ExecStart=/usr/local/bin/node_exporter

[Install]
WantedBy=multi-user.target
And then run:
sudo systemctl daemon-reload \
 && sudo systemctl enable node-exporter \
 && sudo systemctl start node-exporter
The raspberrypi0.lan was picked to be the monitoring host (since version 2 has enough resources and is at the bottom of the stack). In this host, Docker and docker-compose was installed to ease the process of deploying the data collection (Prometheus) and visualization (Grafana) stack: sudo apt install docker docker-compose.
Prometheus require some extra configuration in yaml with information about the hosts:
scrape_configs:
  - job_name: "raspberrypi0"
    static_configs:
      - targets: ["raspberrypi0.lan:9100"]
  - job_name: "raspberrypi1"
    static_configs:
      - targets: ["raspberrypi1.lan:9100"]
  - job_name: "raspberrypi2"
    static_configs:
      - targets: ["raspberrypi2.lan:9100"]
  - job_name: "raspberrypi3"
    static_configs:
      - targets: ["raspberrypi3.lan:9100"]
With the configuration of Prometheus done, we can build our docker-compose.yml with Prometheus and Grafana.
version: "3"

volumes:
  prometheus_data: {}
  grafana_data: {}

services:
  prometheus:
    image: prom/prometheus
    volumes:
      - ./prometheus/:/etc/prometheus/
      - prometheus_data:/prometheus
    command:
      - "-config.file=/etc/prometheus/prometheus.yml"
      - "-storage.local.path=/prometheus"
    expose:
      - 9090
    ports:
      - 9090:9090

  grafana:
    image: grafana/grafana
    depends_on:
      - prometheus
    expose:
      - 3000
    ports:
      - 3000:3000
    volumes:
      - grafana_data:/var/lib/grafana
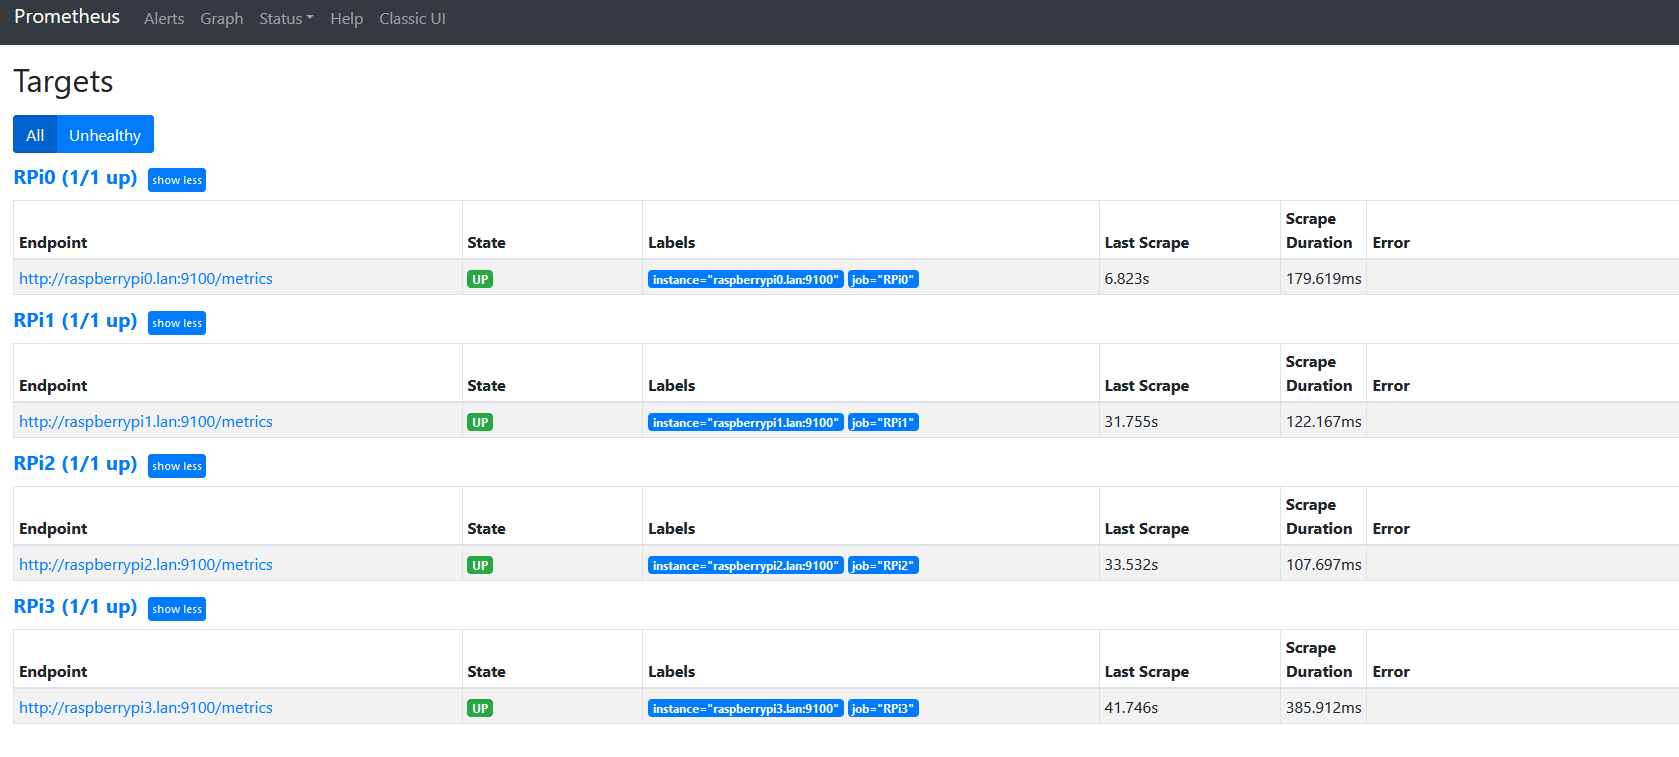
Prometheus provide an out-of-the-box Web UI that allows running queries over the collected metrics – the expression browser and to check the status of the monitoring targets in Status->Targets. The query language documentation can be found here but the autocomplete feature of the expression browser is a good starting point.
For configuring Grafana to retrieve data from Prometheus, go to Data Sources and add a new Prometheus data source, specifying the name of the container as the connection string, prometheus.
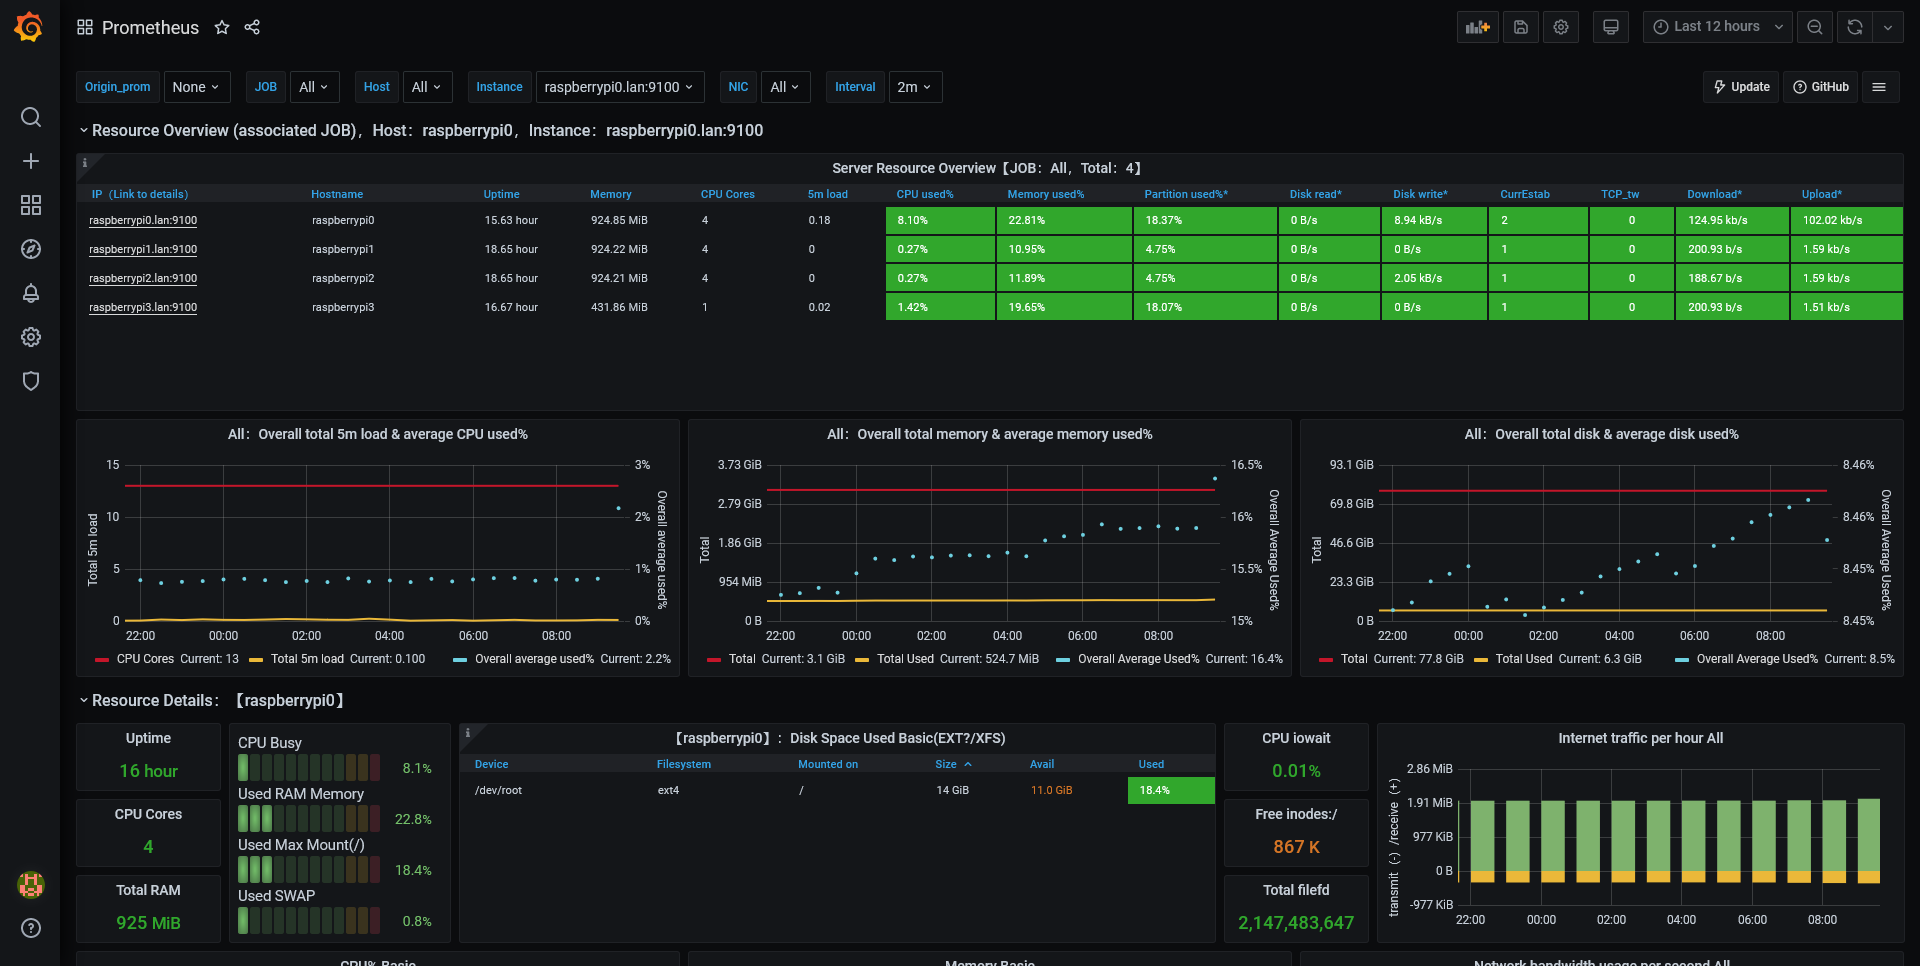
For building the main dashboard with all the metrics on Grafana, I used as base the Node Exporter for Prometheus Dashboard by starsliau. However, some minor changes were required: add a panel with the different RPis temperatures and modify the Job drop-down to let all jobs (since each RPi is a different job). You can find the modified version in this gist.
Additionally, I would like to access metrics related to the router (DD-WRT) and showcase them in the Grafana. However, the TP-Link router does not have JFFS, thus the only build compatible is a micro version that neither provides snmp (which could be fectch using Prometheus snmp_exporter) nor allows to run additional applications (which would enable us to use the Node exporter MIPS build).
Automating Stuff
The final setup consists of 4 different RPis connected by SSH. However, to carry simple tasks, such an update implied manually create an SSH session to each host and run the command. While searching for a solution to quickly run a command in all the hosts at the same time Ansible was repeatedly recommended, since it only requires an SSH connection to the host and a Python interpreter installed in the target machine (which already comes installed in the Raspberry OS).
After installing Ansible in my laptop the first thing was to create an inventory.yml with all my hosts, default Python interpreter (ansible does auto-discovery of the Python interpreter available if not specified) and SSH username:
all:
  hosts:
    raspberrypi0:
      ansible_host: raspberrypi0.lan
    raspberrypi1:
      ansible_host: raspberrypi1.lan
    raspberrypi2:
      ansible_host: raspberrypi2.lan
    raspberrypi3:
      ansible_host: raspberrypi3.lan
  vars:
    ansible_python_interpreter: /usr/bin/python3
    remote_user: pi
After that, with the already configured ssh-agent, we can quickly check if we can reach every RPi with a ping ansible -i inventory.yml -m ping all, obtaining four pongs as answer. Other examples of quick commands:
# Update and upgrade
ansible -i inventory.yml -m apt -a "upgrade=yes update_cache=yes" -b all
# Reboot all
ansible -i inventory.yml -a "reboot" -s all
# Run command to shutdown all
ansible -i inventory.yml -m shell -a "shutdown -h now" all
More complex tasks can now be automated with ansible-playbooks.
References
-
As of December 2019, more than thirty million boards have been sold. ↩
-
While writing this post, I found out that this one is pretty close (almost equal) to what I have built with a pretty similar motivation. ↩
-
This is heavily based on the article Monitor your Raspberry Pi cluster with Prometheus by Alex Ellis. ↩
