A (not so smart) smart home
Internet-of-Things, cyber-physical systems, smart spaces, smart anything… All these buzzwords and keywords are either vendor-generated for pushing ever-complex devices and things from WiFi-controlled kettles to health monitoring devices or created by academia (e.g., Internet-of-Everything, Web-of-Things, Connected Devices, Smart Devices) to sustain minor works by reinventing well-known technologies and approaches. In this post we will go back to the basics of IoT, without all the keyword-driven buzz, and build a simple temperature/humidity monitoring system with a mostly straightforward architecture and with minimal programming/configuration needs.
The Problem
Off-the-shelf IoT devices are typically (1) complex by depending on proprietary application-layer specifications for communicating and, sometimes, even depend on specific hardware, (2) expensive, especially if you wish for something more or less reliable, (3) depend on proprietary software (with all the bonus telemetry and other goods powered by some states), and, lastly, (4) they do a lot of unnecessary things (e.g., always-on microphones).
Nonetheless, I see the potential in IoT, although I disagree with how most IoT systems are built today. For simple problems, simple solutions (and, preferably, cheap ones). And the problem is simple, and I want to monitor the humidity and temperature of several rooms in a two-floor house. But (1) I should be able to do it with cheap off-the-shelf devices (even if I need to flash them), (2) the setup/programming should be minimal, (3) data should be available anywhere anytime, and (4) the architecture of the system should be minimal, i.e., I do not want to run five different services on top of an always-on Raspberry Pi just to be able to see a chart with some data points.
The Approach
Finding the Right Device
First things first, we need a sensor device capable of collecting temperature/humidity and communicating this data wirelessly. There are a lot of sensors in the market capable of doing such using different protocols and with different power efficiency solutions.
For starters, we could use some WiFi-based setup, with some cheap ESP8266 plus a DHT22; however, the power consumption of those devices is not that low, so it would require some maintenance in terms of batteries (and, further, it would require some soldering and manual wiring). Next, we could use some ZigBee / Thread / Matter or whatever Connectivity Standards Alliance is now pushing as the “solution” for the standards issue1, but that would require specific hardware or some DIY gateway with a Raspberry and a ZigBee / Thread dongle, so no-go. There are other “state-of-the-art” solutions, but they are typically expensive or over-engineered for this use case.
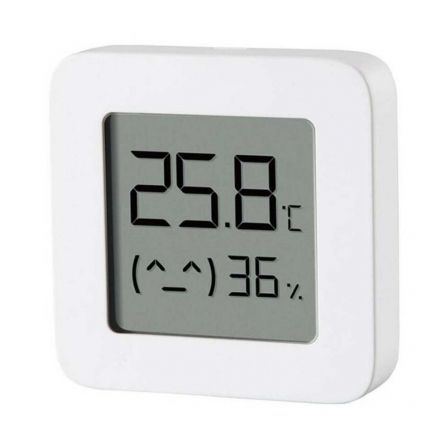
Lastly, one of the technologies that have been around for some time now (circa 2009) and have proven to be one of the most battery-efficient ones is Bluetooth Low Energy. And as one of the oldest techs, it is easy to find cheap devices that leverage the protocol, one of them being the Xiaomi MIJIA Temperature and Humidity Monitor 2 (model: LYWSD03MMC), which can be found for around 5$ a piece.
Removing the Xiaomi Mi Home Dependency (Flashing Firmware)
Although Xiaomi devices are typically well built, their software is terrible. In this case, the device requires the Xiaomi Mi Home application to get the data that the sensor collects. While this was a no-go, there is a simple way to get the bindkey which allows any other Bluetooth-enabled device to get data from the sensor devices. An example is using esphome running on some ESP32. A detailed process on how to get the bindkey and collect data from the sensors is available on esphome docs, using the TelinkFlasher by ATC1441. The process is seamless, as the web app can connect to the Bluetooth device (Chromium-based browser recommended) and then use specific commands to get the key (so no wiring is needed!).
Moreover, this specific sensor has several alternative firmware available that allow one to configure (and even improve) the behavior and communication style of these sensors. Looking at the ATC_MiThermometer firmware by pvvx2, adds several improvements to the device, including extended battery life (over a year), improved measurement accuracy, and extended format in 0.01 units, and adjustable RF TX Power & Bluetooth advertising interval.
The flashing process is straightforward and thoughtfully explained in the repo readme. I left my devices with the default firmware configurations, but it is possible to further adjust it. By default, the devices advertise the values they are reading using the firmware default custom format.
Note: In the case of flashing several devices, I recommend keeping track of the MAC address of the devices by connecting (inserting the battery) each one separately and checking the device MAC using, as an example, the Nordic nRF Toolbox, and write it down in the back of the sensor.
Building a Low-Power Gateway
The data can be collected from the devices easily, using ESPHome on an ESP32, as was already mentioned. A sample example of such would be using a configuration like the following:
esp32_ble_tracker:
  active: false

sensor:
  - platform: xiaomi_lywsd03mmc
    mac_address: "A4:C1:38:AA:AA:AA"
    bindkey: "eef418daf699a0c188f3bfd17e4565d9"
    temperature:
      name: "LYWSD03MMC Temperature"
    humidity:
      name: "LYWSD03MMC Humidity"
    battery_level:
      name: "LYWSD03MMC Battery Level"
However, the system becomes unstable when more than one sensor is configured at the same time, leading to several malloc failures. This also limits the ability to configure the transmission of data using MQTT or HTTP to a data storage service, so ESPHome did not work for this case.
Another option would be using OpenMQTTGateway, but using it would require an MQTT broker and some middleware (e.g., Node-RED) to consume from the MQTT topics and send the data to some database3.
Lastly, the option chosen was to program a minimal Arduino program that runs on the ESP32 that collects data from the sensor devices and, using REST, directly writes the data to a database. To fulfill all the requirements, this needed to be a cloud-based database, preferably with some kind of visualization toolkit available, so InfluxDB Cloud was selected. The free tier retains data from the last 30 days, which is more than enough to understand the thermal and isolation performance of the home4.
The Arduino program was built using two libraries:
By leveraging those libs, the program is less than 80 lines of code:
#include "ATC_MiThermometer.h"
#include <WiFi.h>
#include <InfluxDbClient.h>
#include <InfluxDbCloud.h>

const char *ssid = "---";
const char *password = "---";

#define TZ_INFO "WET-0WEST-1,M3.5.0/01:00:00,M10.5.0/02:00:00" // lisbon time
#define INFLUXDB_URL "https://example.influxdata.com"
#define INFLUXDB_TOKEN "base64=="
#define INFLUXDB_ORG "org"
#define INFLUXDB_BUCKET "bucket"

// List of known sensors' BLE addresses
std::vector<std::string> knownBLEAddresses = {
    "A4:C1:38:11:11:11",
    "A4:C1:38:22:22:22" };

// List of localizations
std::vector<std::string> locations = {
    "office",
    "entrance" };

InfluxDBClient client(INFLUXDB_URL, INFLUXDB_ORG, INFLUXDB_BUCKET, INFLUXDB_TOKEN);
const int scanTime = 5; // BLE scan time in seconds
ATC_MiThermometer miThermometer(knownBLEAddresses);

void setup() {
    Serial.begin(115200);
    WiFi.begin(ssid, password);
    Serial.println("Connecting");
    while (WiFi.status() != WL_CONNECTED) {
        delay(500);
        Serial.print(".");
    }
    Serial.print("Connected to WiFi network with IP Address: ");
    Serial.println(WiFi.localIP());
    timeSync(TZ_INFO, "pool.ntp.org", "time.nis.gov");
    // do not validate TLS (this should be changed)
    client.setInsecure();
    miThermometer.begin();
}

void loop() {
    // Set sensor data invalid
    miThermometer.resetData();
    // Get sensor data - run BLE scan for <scanTime>
    unsigned found = miThermometer.getData(scanTime);

    for (int i = 0; i < miThermometer.data.size(); i++) {
        if (miThermometer.data[i].valid){
            Serial.printf("Sensor %d: %s\n", i, knownBLEAddresses[i].c_str());
            Serial.printf("Location %d: %s\n", i, locations[i].c_str());
            Serial.printf("%.2f°C\n", miThermometer.data[i].temperature / 100.0);
            Serial.printf("%.2f%%\n", miThermometer.data[i].humidity / 100.0);
            Serial.printf("%.3fV\n", miThermometer.data[i].batt_voltage / 1000.0);
            Serial.printf("%d%%\n", miThermometer.data[i].batt_level);

            Point sensor("atc_mithermometer");
            if (WiFi.status() == WL_CONNECTED) {
                sensor.addTag("location", locations[i].c_str());
                sensor.addTag("mac", knownBLEAddresses[i].c_str());
                // Report RSSI of currently connected network
                sensor.addField("temperature", miThermometer.data[i].temperature / 100.0);
                sensor.addField("humidity", miThermometer.data[i].humidity / 100.0);
                sensor.addField("batt_level", miThermometer.data[i].batt_level);
                // Print what are we exactly writing
                Serial.print("Writing: ");
                Serial.println(client.pointToLineProtocol(sensor));
                if (!client.writePoint(sensor)) {
                    Serial.print("InfluxDB write failed: ");
                    Serial.println(client.getLastErrorMessage());
                }
            } else { Serial.println("WiFi Disconnected"); }
        }
    }
    // Delete results fromBLEScan buffer to release memory
    miThermometer.clearScanResults();
    delay(60000 * 10); // run each 10min
}
InfluxBD uses the line protocol as a way of writing data over HTTP into the database, including tags (here used for device location and MAC), datapoints (humidity, temperature, and battery level), and time (using NTP data).
Building a Dashboard (Final Result)
Now that we have data being collected and sent to InfluxDB is time to build a dashboard. InfluxDB has a built-in dashboard-building tool that allows data from buckets to be explored and transformed.

As data points are only being collected every 10 minutes, to have a smooth curve, we can use the interpolate function:
import "interpolate"

from(bucket: "bucket")
  |> range(start: v.timeRangeStart, stop: v.timeRangeStop)
  |> filter(fn: (r) => r["_measurement"] == "atc_mithermometer")
  |> filter(fn: (r) => r["_field"] == "temperature")
  |> interpolate.linear(every: 1m)
  |> aggregateWindow(every: v.windowPeriod, fn: last, createEmpty: false)
  |> yield(name: "last")
This gives us a view of temperature per device (tagged by location and mac address). InfluxDB also has built-in features to trigger alerts when some threshold is bypassed and to create deadman checks that trigger when some measurement has no new data for a period of time.
Next Steps
Given the 30 days retention limit of InfluxDB free tier, one solution for backing up old data could be built using some FaaS service (e.g. Cloudflare Workers). As an example, the backup serverless function could be like a cron job that runs each 30 days and downloads all the data from InfluxDB as a CSV and uploads it to some cloud data storage provider.
References
-
The ATC_MiThermometer firmware by pvvx supports Xiaomi Mijia (LYWSD03MMC) as well as the Xiaomi Miaomiaoce (MHO-C401), the Qingping Temp & RH Monitor (CGG1-Mijia), and the CGDK2 Qingping Temp & RH Monitor Lite. ↩
-
InfluxDB MQTT Native Collector has the potential to fill in this gap by requiring only a broker but no middleware, but it is a paid-tier only feature. @InfluxDB, why not a free tier? ↩
-
An alternative to InfluxDB would be to use the Google Sheets API to store data in sheets by making REST requests and, then, add some charts that update automatically when new lines are added. ↩
